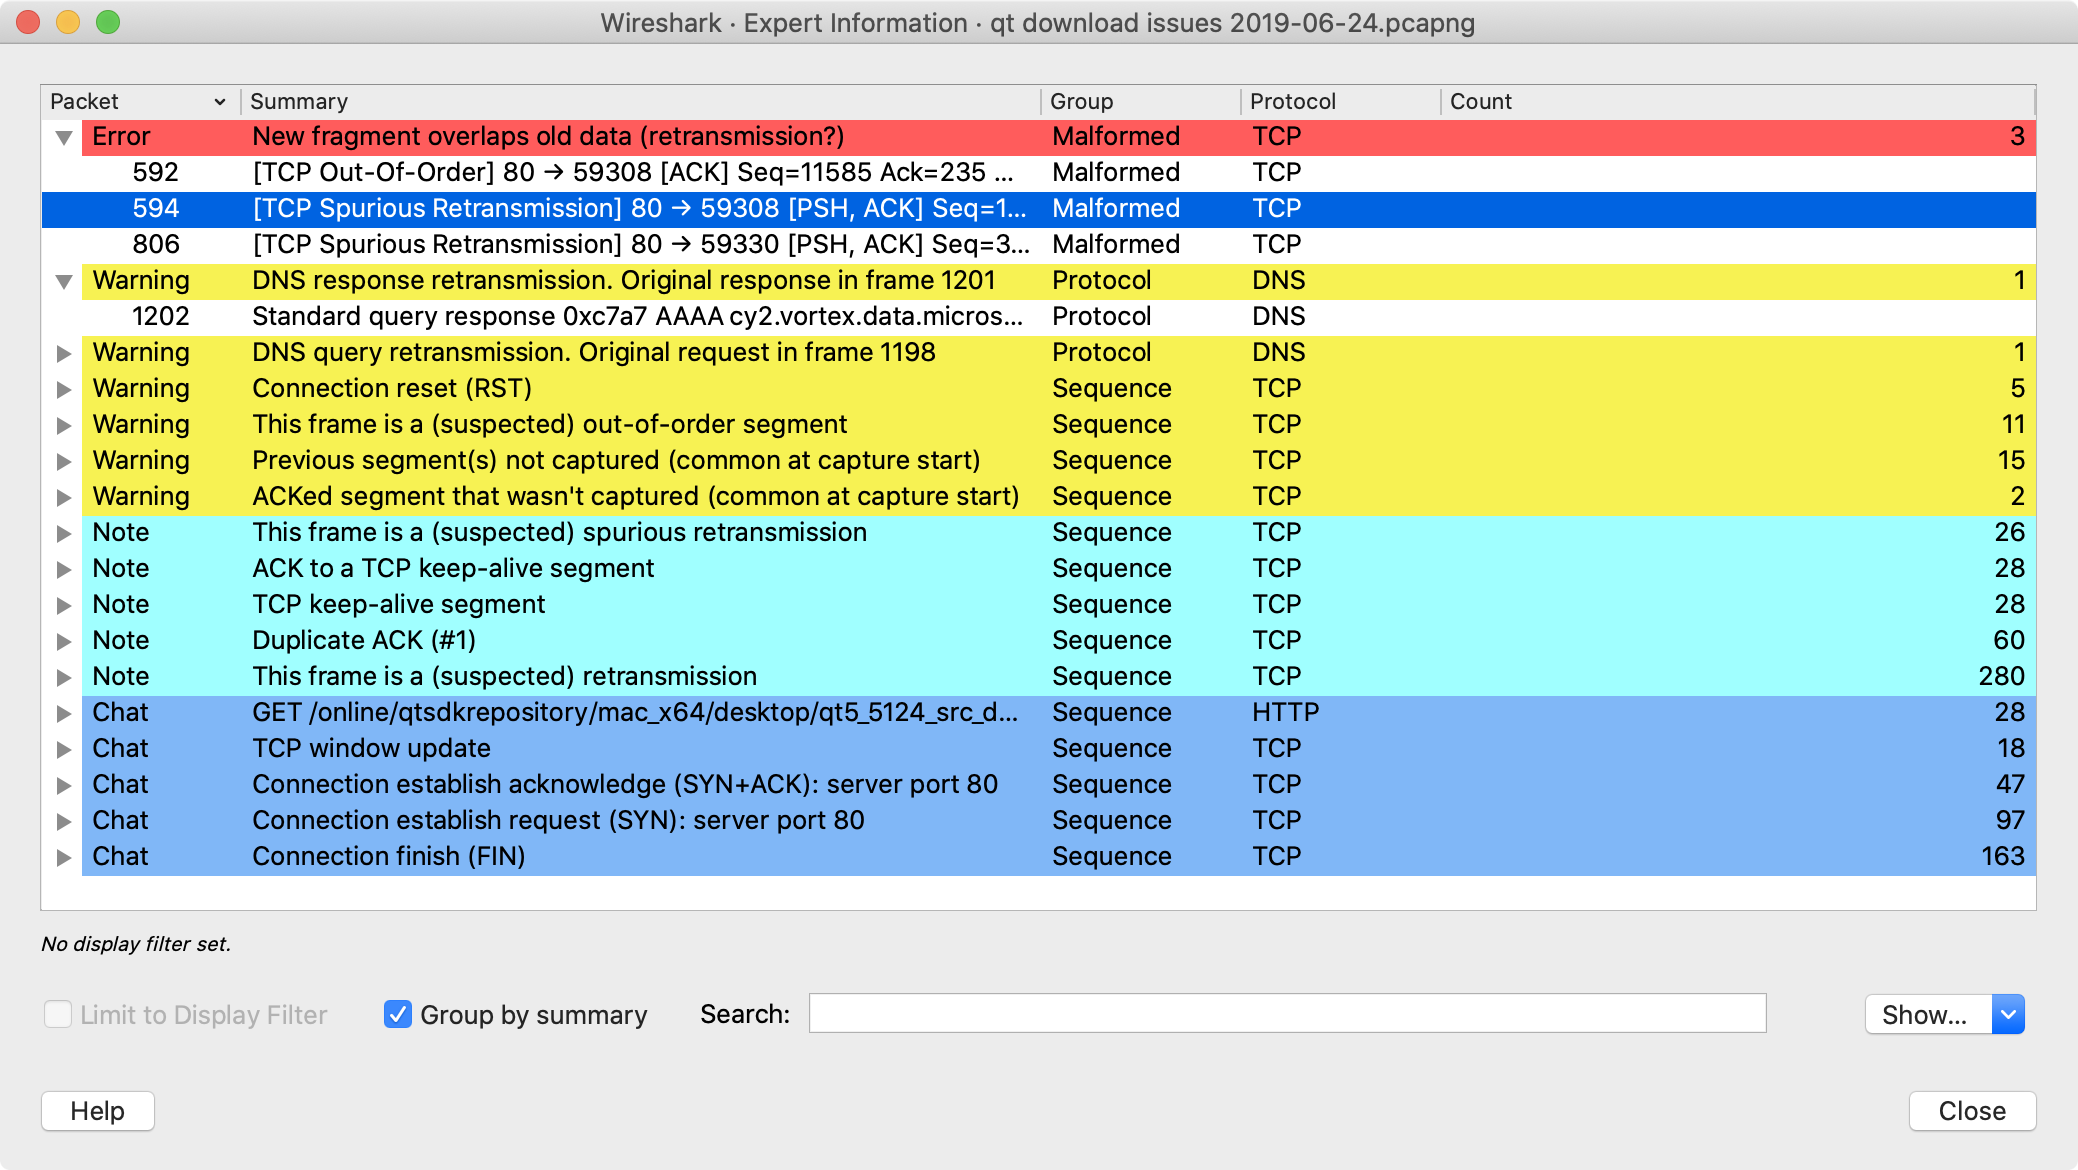
Wireshark keeps track of any anomalies and other items of interest it finds in a capture file and shows them in the Expert Information dialog. The goal is to give you a better idea of uncommon or notable network behaviour and to let novice and expert users find network problems faster than manually scanning through the packet list.
![[Warning]](wsug_graphics/warning.svg) | Expert information is only a hint |
|---|---|
|
Expert information is the starting point for investigation, not the stopping point. Every network is different, and it’s up to you to verify that Wireshark’s expert information applies to your particular situation. The presence of expert information doesn’t necessarily indicate a problem and absence of expert information doesn’t necessarily mean everything is OK. |
The amount of expert information largely depends on the protocol being used. While dissectors for some common protocols like TCP and IP will show detailed information, other dissectors will show little or none.
The following describes the components of a single expert information entry along with the expert user interface.
Expert information entries are grouped by severity level (described below) and contain the following:
Table 7.1. Example expert information items
| Packet # | Summary | Group | Protocol |
|---|---|---|---|
592 | TCP: [TCP Out-Of-Order] … | Malformed | TCP |
1202 | DNS: Standard query response … | Protocol | DNS |
443 | TCP: 80 → 59322 [RST] Seq=12761 Win=0 Len=0 | Sequence | TCP |
Every expert information item has a severity level. The following levels are used, from lowest to highest. Wireshark marks them using different colors, which are shown in parentheses:
- Chat (blue)
- Information about usual workflow, e.g. a TCP packet with the SYN flag set.
- Note (cyan)
- Notable events, e.g. an application returned a common error code such as HTTP 404.
- Warn (yellow)
- Warnings, e.g. application returned an unusual error code like a connection problem.
- Error (red)
- Serious problems, such as malformed packets.
Along with severity levels, expert information items are categorized by group. The following groups are currently implemented:
- Assumption
- The protocol field has incomplete data and was dissected based on assumed value.
- Checksum
- A checksum was invalid.
- Comment
- Packet comment.
- Debug
- Debugging information. You shouldn’t see this group in release versions of Wireshark.
- Decryption
- A decryption issue.
- Deprecated
- The protocol field has been deprecated.
- Malformed
- Malformed packet or dissector has a bug. Dissection of this packet aborted.
- Protocol
- Violation of a protocol’s specification (e.g. invalid field values or illegal lengths). Dissection of this packet probably continued.
- Reassemble
- Problems while reassembling, e.g. not all fragments were available or an exception happened during reassembly.
- Request Code
- An application request (e.g. File Handle == x). Usually assigned the Chat severity level.
- Response Code
- An application response code indicates a potential problem, e.g. HTTP 404 page not found.
- Security
- A security problem, e.g. an insecure implementation.
- Sequence
- A protocol sequence number was suspicious, e.g. it wasn’t continuous or a retransmission was detected.
- Undecoded
- Dissection incomplete or data can’t be decoded for other reasons.
It’s possible that more groups will be added in the future.
You can open the expert info dialog by selecting → or by clicking the expert level indicator in the main status bar.
Right-clicking on an item will allow you to apply or prepare a filter based on the item, copy its summary text, and other tasks.
You can choose from the following actions:
- Limit to display filter
- Only show expert information items present in packets that match the current display filter.
- Group by summary
- Group items by their summary instead of the groups described above.
- Search
- Only show items that match the search string, such as “dns”. Regular expressions are supported.
- Lets you show or hide each severity level. For example, you can deselect Chat and Note severities if desired.
- Takes you to this section of the User’s Guide.
- Closes the dialog
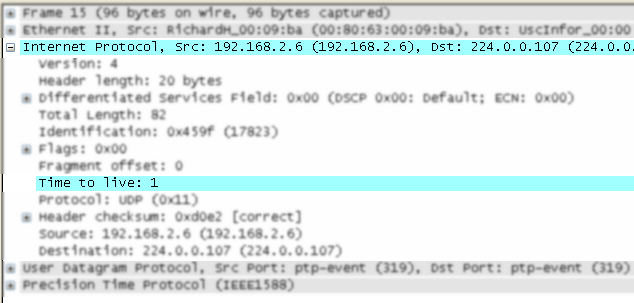
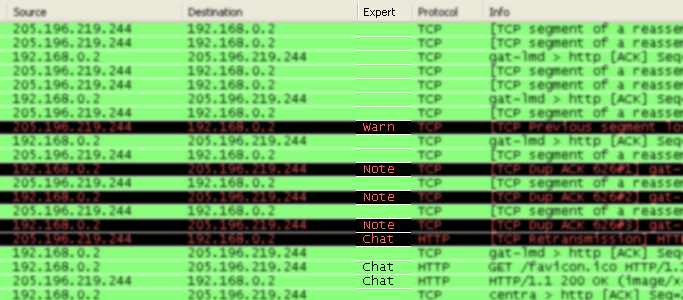
The packet detail tree marks fields with expert information based on their severity level color, e.g. “Warning” severities have a yellow background. This color is propagated to the top-level protocol item in the tree in order to make it easy to find the field that created the expert information.
For the example screenshot above, the IP “Time to live” value is very low (only 1), so the corresponding protocol field is marked with a cyan background. To make it easier find that item in the packet tree, the IP protocol toplevel item is marked cyan as well.
An optional “Expert Info Severity” packet list column is available that displays the most significant severity of a packet or stays empty if everything seems OK. This column is not displayed by default but can be easily added using the Preferences Columns page described in Section 11.5, “Preferences”.