Hi,
Running valgrind on my standard pcap we have gone from
==36946== Callgrind, a call-graph generating cache profiler
==36946== Copyright (C) 2002-2013, and GNU GPL'd, by Josef Weidendorfer et al.
==36946== Using Valgrind-3.10.0.SVN and LibVEX; rerun with -h for copyright info
==36946== Command: /home/ericsson/wireshark/.libs/lt-tshark -Y frame -nr /home/ericsson/etxrab/TCT_SIP_traffic.pcapng
==36946==
==36946== For interactive control, run 'callgrind_control -h'.
==36946==
==36946== Events : Ir
==36946== Collected : 18211043816
==36946==
==36946== I refs: 18,211,043,816
to
==4865==
==4865== Events : Ir
==4865== Collected : 1595333469530
==4865==
==4865== I refs: 1,595,333,469,530
The big difference seems to be
Latest June
87.95 37.92 6 076 548 g_hastable_lookup 5.56 2.98 6 515 523
Looking deeper
49.43 25 142 686 213 conversation_match_exact 0.32 576 548
Regards
Anders
From: wireshark-dev-bounces@xxxxxxxxxxxxx [mailto:wireshark-dev-bounces@xxxxxxxxxxxxx]
On Behalf Of POZUELO Gloria (BCS/PSD)
Sent: den 2 december 2015 14:01
To: Developer support list for Wireshark; alexis.lagoutte@xxxxxxxxx
Subject: Re: [Wireshark-dev] Wireshark Performance
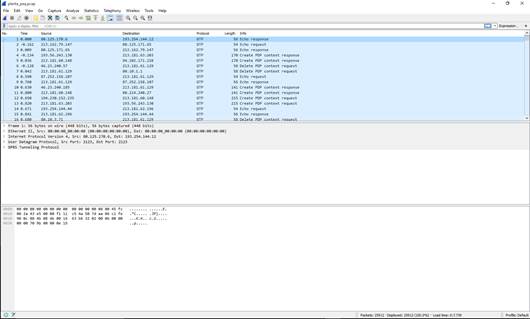
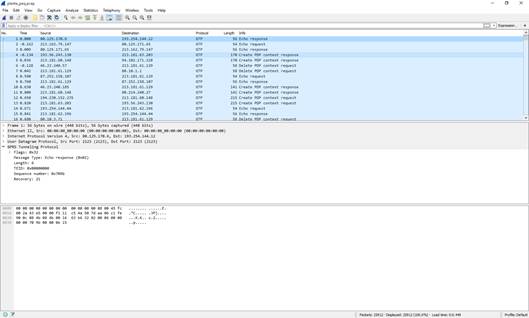
I’ve been testing the performance a little more and it seems that the loading time has increased not only for GTP protocol. I have sniffed a pcap
composed by 22844 packets and if you open it up with both versions, v2.0 lasts 0.520s and v2.1 lasts 1.433s. But as you saw before for GTP protocol is even worse, I’ll try to get a pcap example that I can share.
Regards.
I can’t share this one, because it has user data and it’s confidential, but we are going to generate another one that can be share. We are using
GTP protocol, if that gives you a clue.
From:
wireshark-dev-bounces@xxxxxxxxxxxxx [mailto:wireshark-dev-bounces@xxxxxxxxxxxxx]
On Behalf Of Alexis La Goutte
Sent: Wednesday 2 December 2015 09:08
To: Developer support list for Wireshark
Subject: Re: [Wireshark-dev] Wireshark Performance
You can directly add the text output of load time...
It is possible to share your pcap ?


